Tate
Tozer
Merchant Churn
A hasty launch to BP caused significant issues and spiked merchant churn requests. With limited outreach capability and an overwhelmed Account Management team, I was tasked with finding a way to reach this new segment and stop churn efficiently.
Role
UX
Problems
- When we launched the program to BP, we focused on educating Territory Leads and Regional Directors. We tasked them with being product champions of the program and educating their Station Operators. This arrangement was convenient but they did a poor job of notifying Station Operators and explaining charges for a “GetUpside program”.
- Attempts to build an email list failed, and we could not reliably reach or scale phone calls to thousands of Operators.
Solutions
- I interviewed our Account Management team to learn how to rescue Operators. From these conversations, I was able to come up with a list of key figures and FAQs to address in my solution.
- I reached out to our Product Champions and asked them the same set of questions. I also asked them to help me build a profile of the Operators we were trying to reach. Through this I learned that Operators were not considered tech savvy, and relied on snail mail for invoicing and correspondence. This insight was a key moment for establishing a communication channel, we already had addresses for every station at risk.
Results
- I presented findings to the leadership team, and proposed sending a report via traditional mail with key results, FAQs, and a call to action.
- Working with the leadership team, we got permission to use their letterhead and mail their Operators a report.
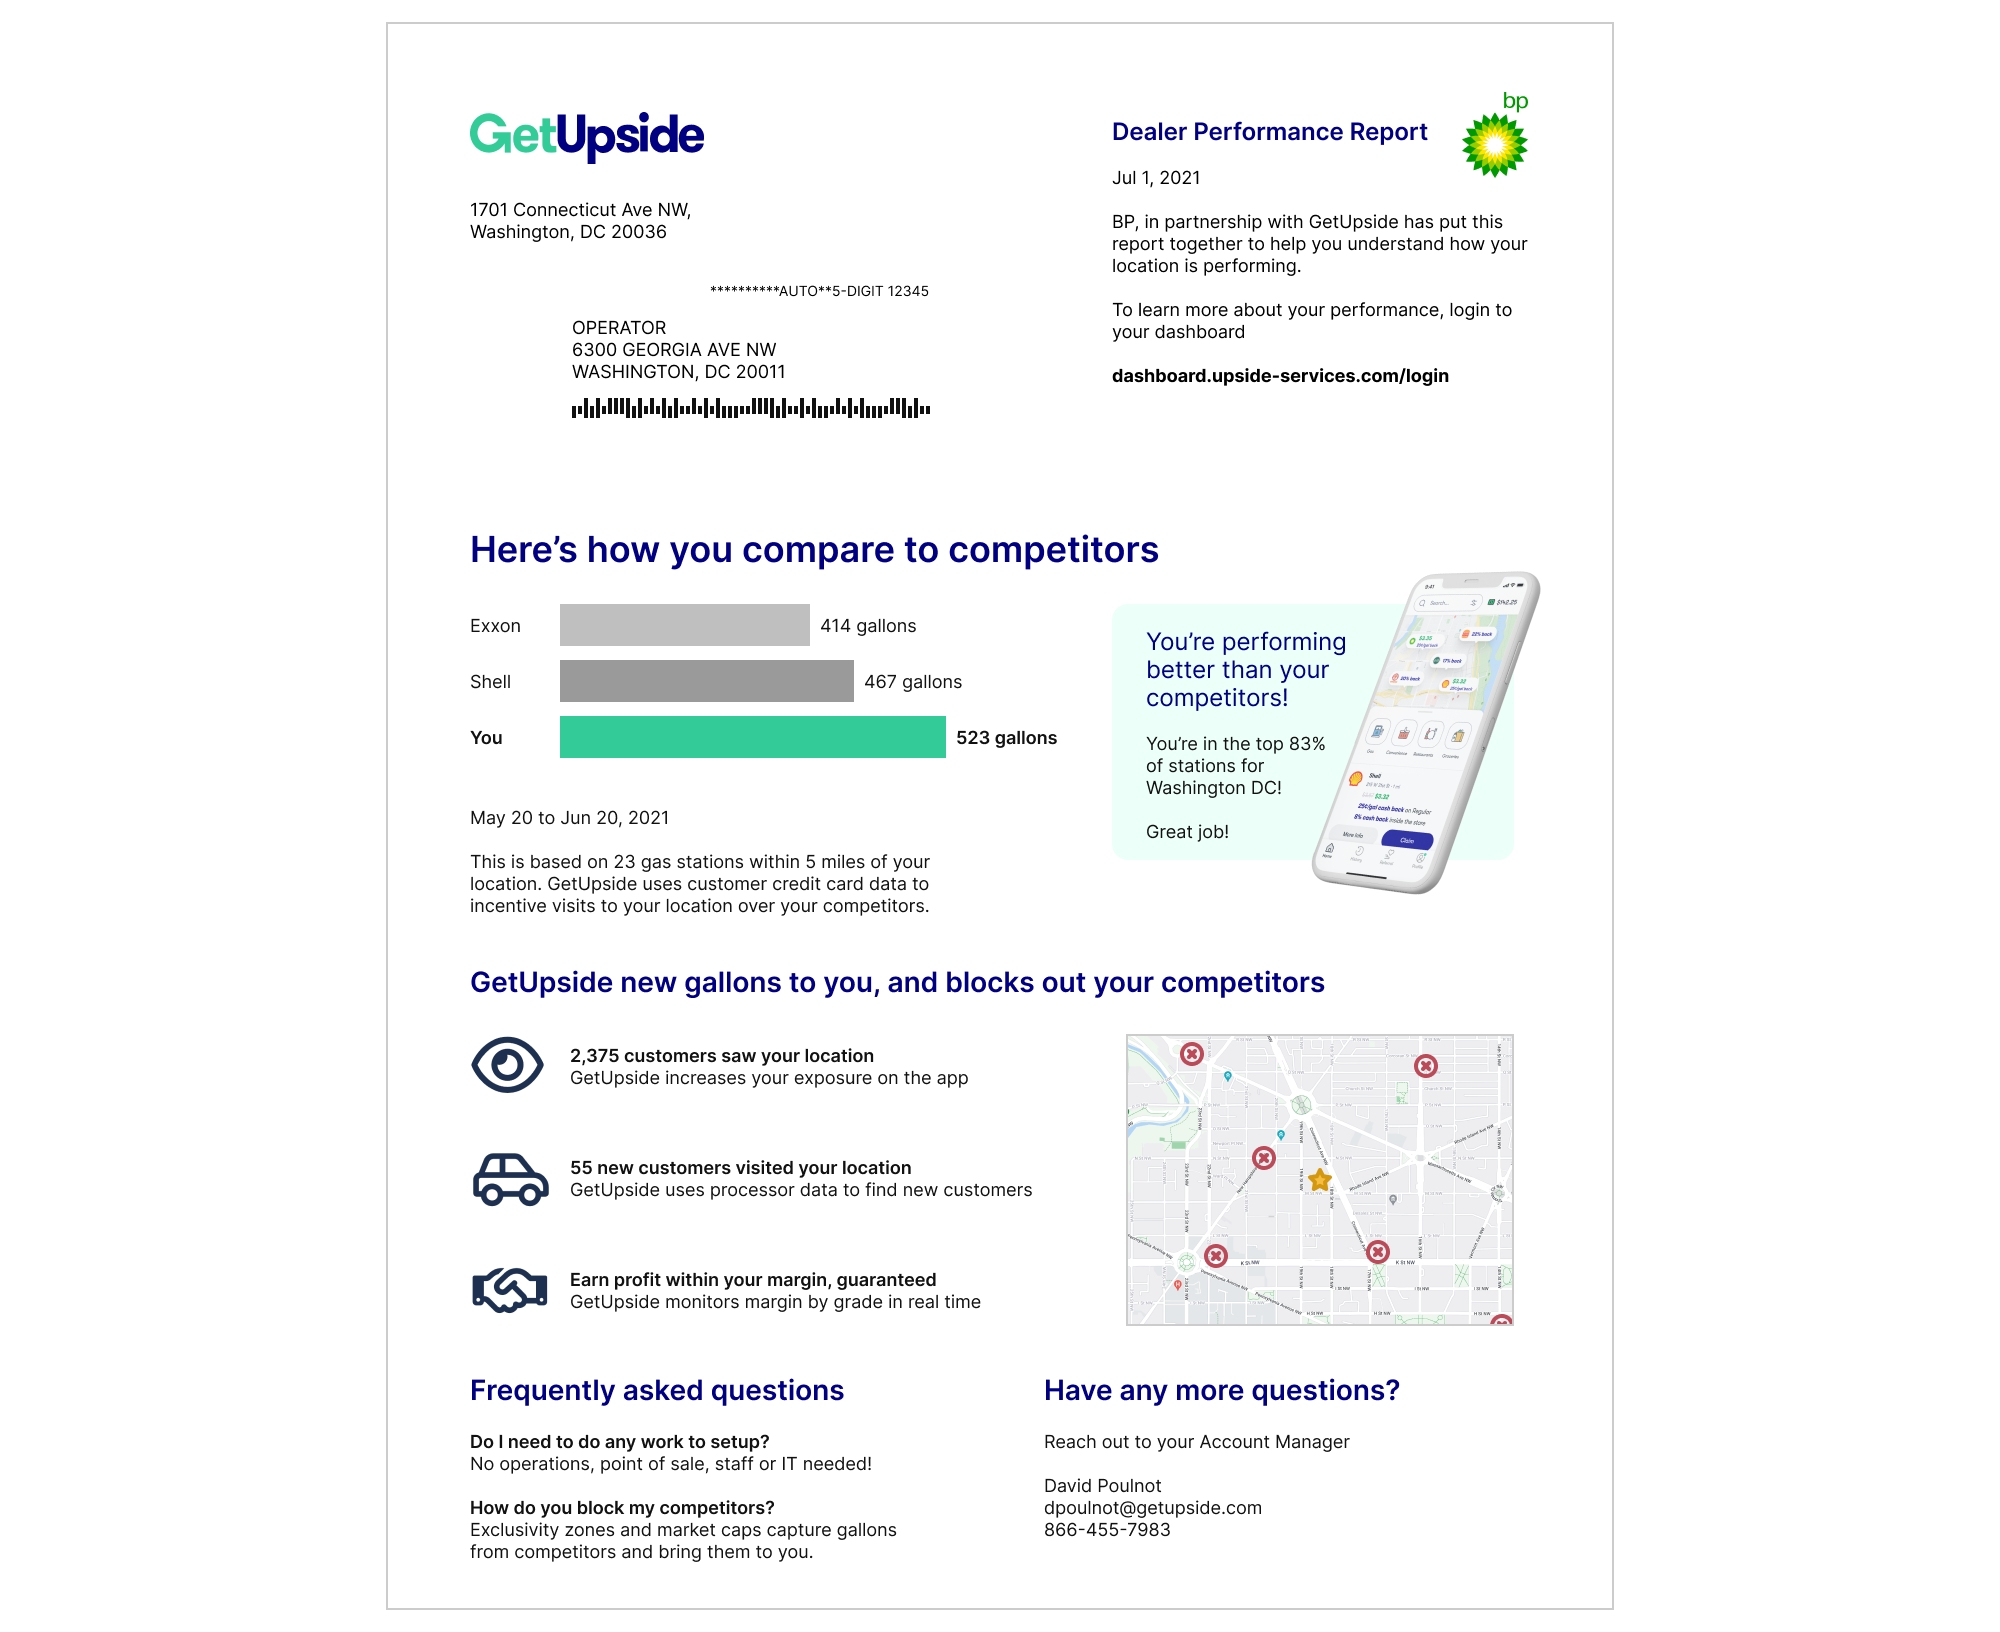 Personalized paper mailer report sent out to Merchants at risk of churn
Problem
- With a list of key insights on hand, we turned to productize a solution. No one at the company had executed a direct mail campaign, and with a list of 5000+ addresses the process had to be automated.
- Merchants might still have questions, and our Account Management team was too small to handle more requests.
Solutions
- Engineering was tasked with compiling a spreadsheet. Each row a different gas station with columns for address, metrics, and the AM for that station.
- Meanwhile I focused on wireframing, testing, and iterating on the report. I also had to learn the USPS rules for direct mail, and automating an illustrator script to render a personalized report based on the rows in the spreadsheet.
- I looked for vendors that could print, stuff, and mail each report for us.
- The main CTA for the report drove Merchants to the Dashboard. We made changes to the Dashboard to address feedback from churn requests and positioned it as a self-service tool to take pressure off Account Management.
Results
- Major drop in churn requests 10 days from when the reports were mailed out. This drop correlated with delivery of the reports, phone calls and subsequent Merchant surveys credited the report.
- Report took a lot of pressure off the Account Management team. Each report cost $4.24 to deliver. Far cheaper than the cost of a phone call.
- Raised program and brand awareness with this segment of merchants.
- After initial setup, the entire process ran on autopilot – no human intervention, or design cycles needed.
- Fewer than 5% of the reports got returned to us. Puzzled by the returns, further investigation helped identify a bug in our location data, which was effecting reconciles in the consumer app.
We knew Merchants would have questions about their profit statement, so we built a walkthrough
to explain each line item. Click ⤢ to expand.
to explain each line item. Click ⤢ to expand.
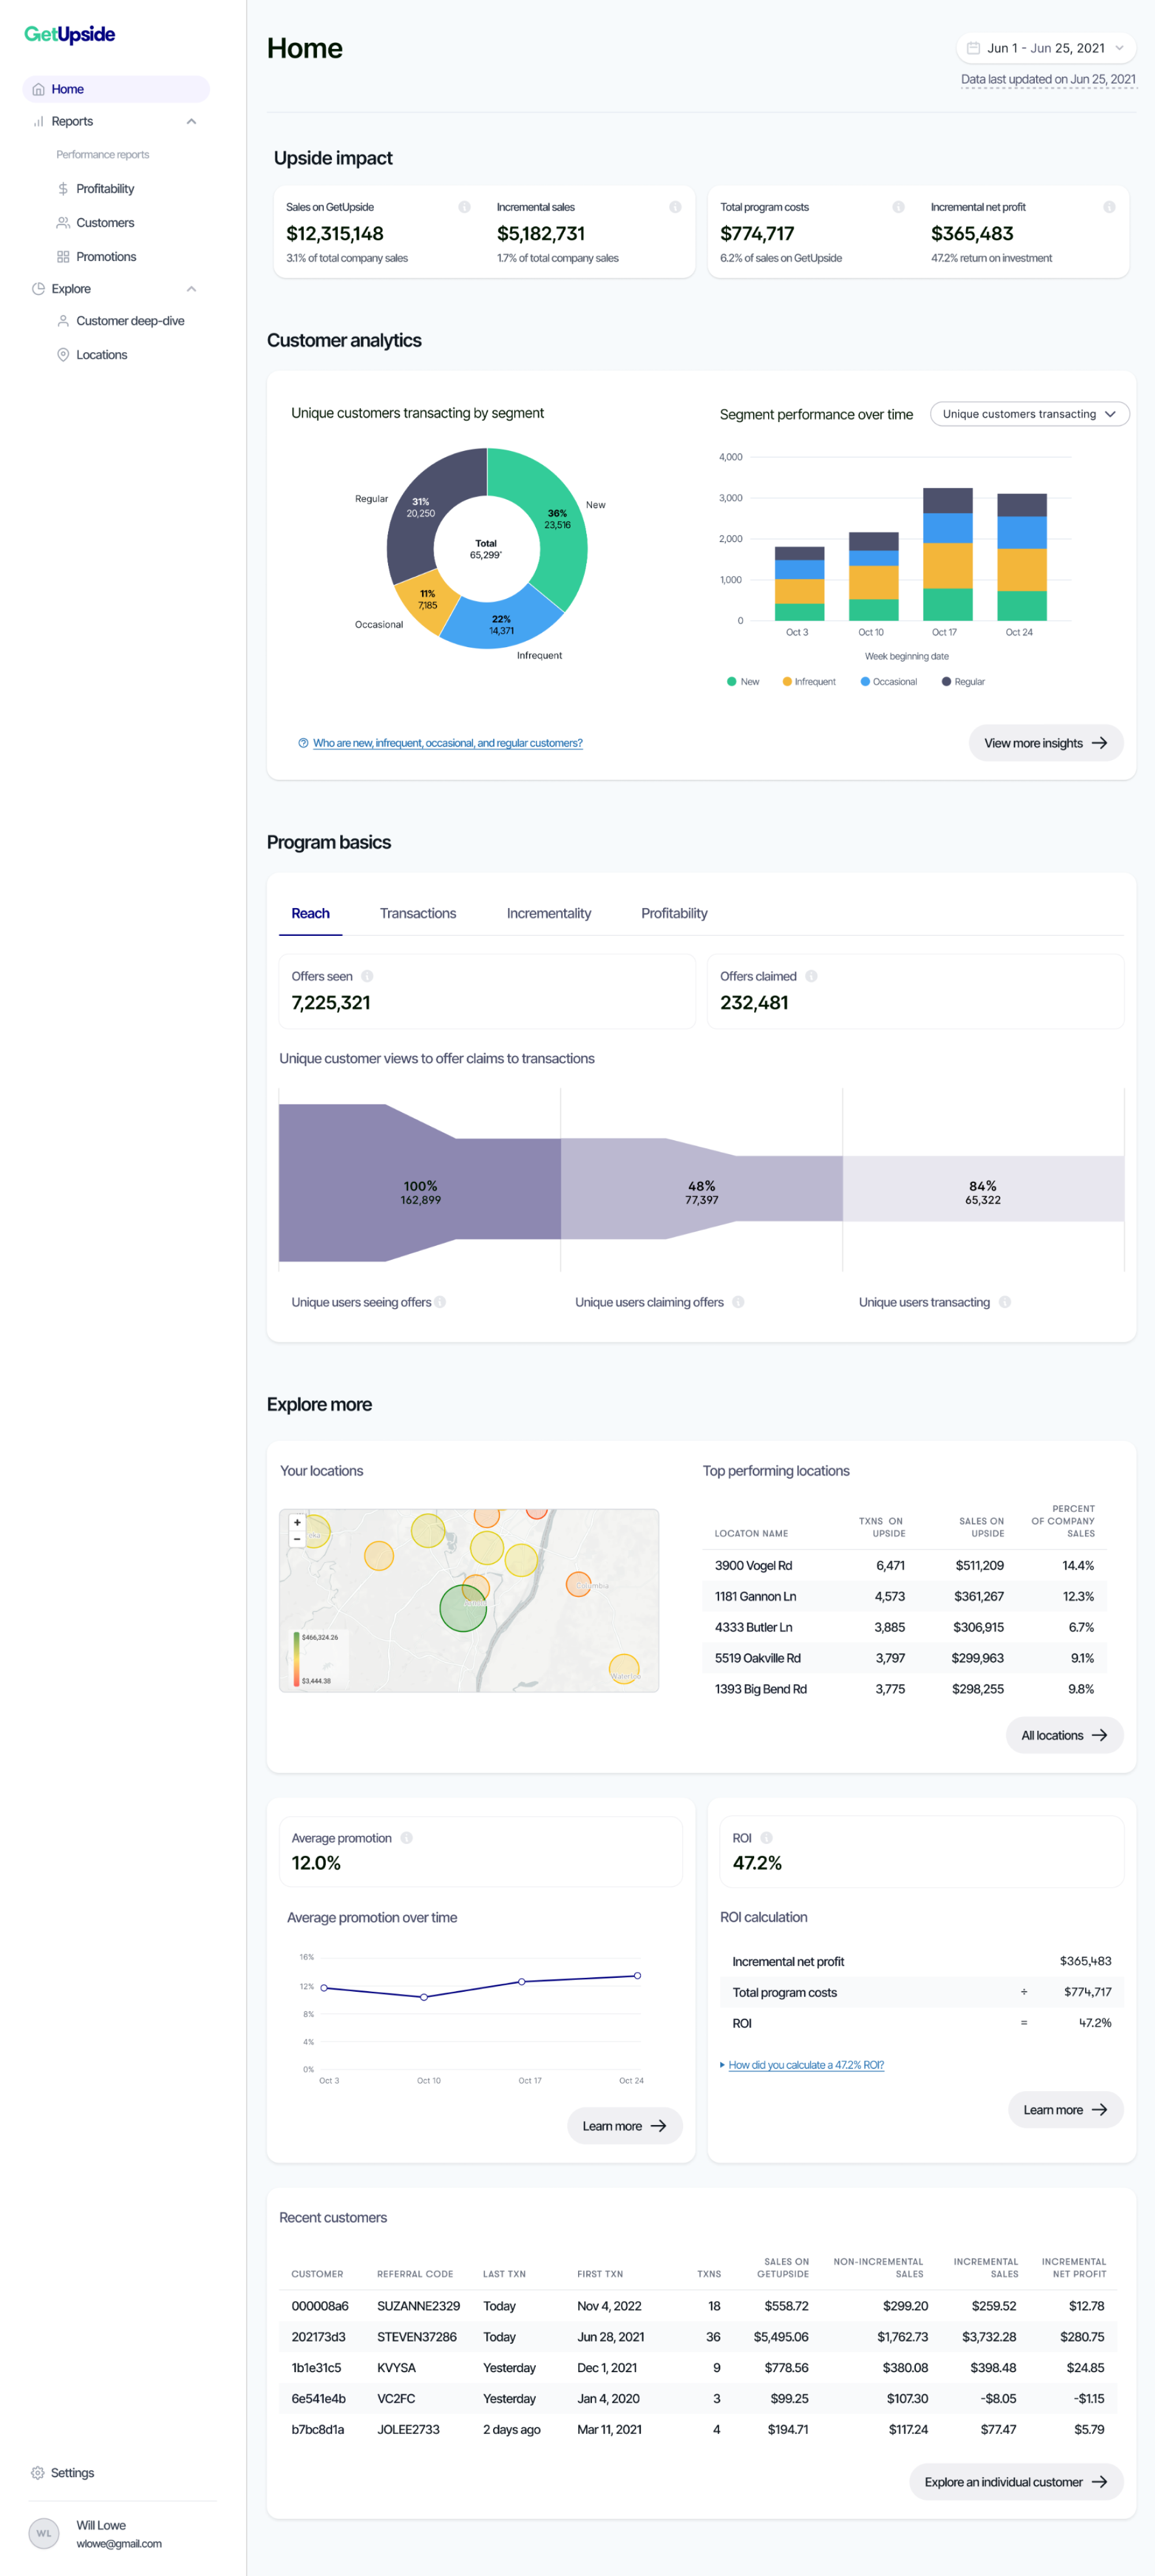 We updated our Dashboard to anticipate key questions from Merchants, and support Account Management team